CCL

Playing around with the NAF ranking system got me wondering how easy it would be to produce something similar for CCL (or potentially any BB2 league). Looking through the information about the Glicko rating system, there are several implementations of the Glicko2 algorithm the NAF has chosen to use, but unfortunately only the original Glicko algorithm is available as an R package. In order to try and match the NAF approach as much as possible I have therefore put together my own implementation of Glicko2 and can provide an initial look at the results today.
A few people have been asking for some more details about the principal components in the previous post, so strap in for some more graphy goodness. We’ll even dive a bit deeper into the weeds by looking at the third and fourth principal components for each league, taking our level of explained variation just above 50%.
Before we begin however, it’s worth raising a few important caveats from discussions I’ve seen.

One sure thing about Blood Bowl is that if you start talking about race classification there will be inevitable debates about which team fits where. After watching yet another of these discussions around the standard bash/dash/hybrid distinction I decided to see if taking a data-driven approach could provide an interesting perspective. To do so, we’ll look at matches from a few different leagues to see if our results are consistent.

Now that we have gotten our feet wet with the Champion Ladder data, it’s time to start looking at some actual match results.
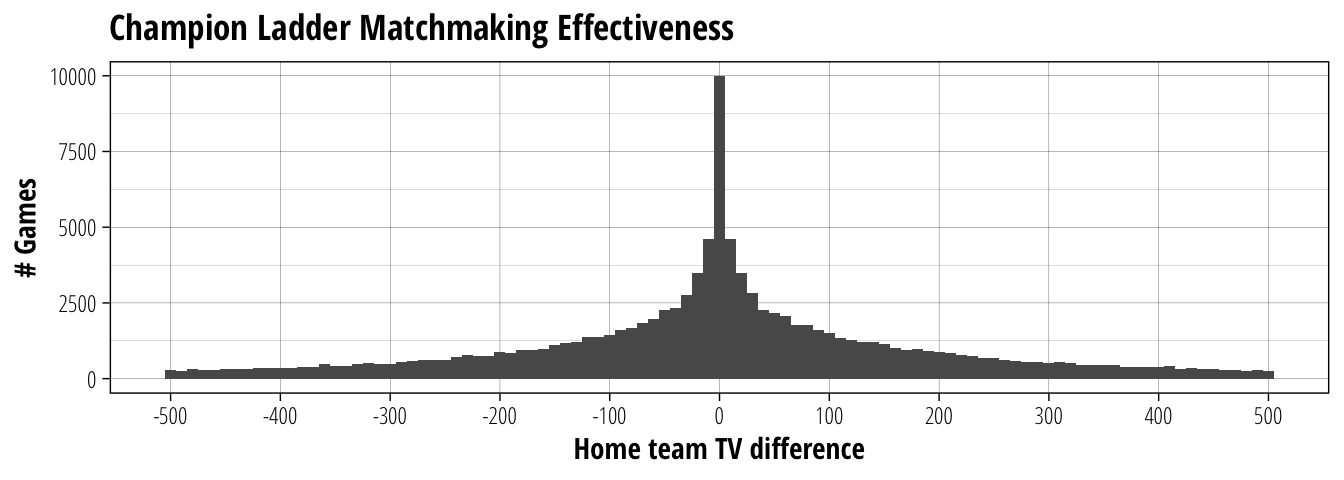
We are going to start with Team Value because it’s an interesting mechanic in Blood Bowl that plays a number of complementary roles:
It provides the initial constraint on team composition, meaning that a fresh team never quite has everything you would like. It underpins matchmaking in the Champion Ladder, making TV management an important aspect of long-term strategic decision making.

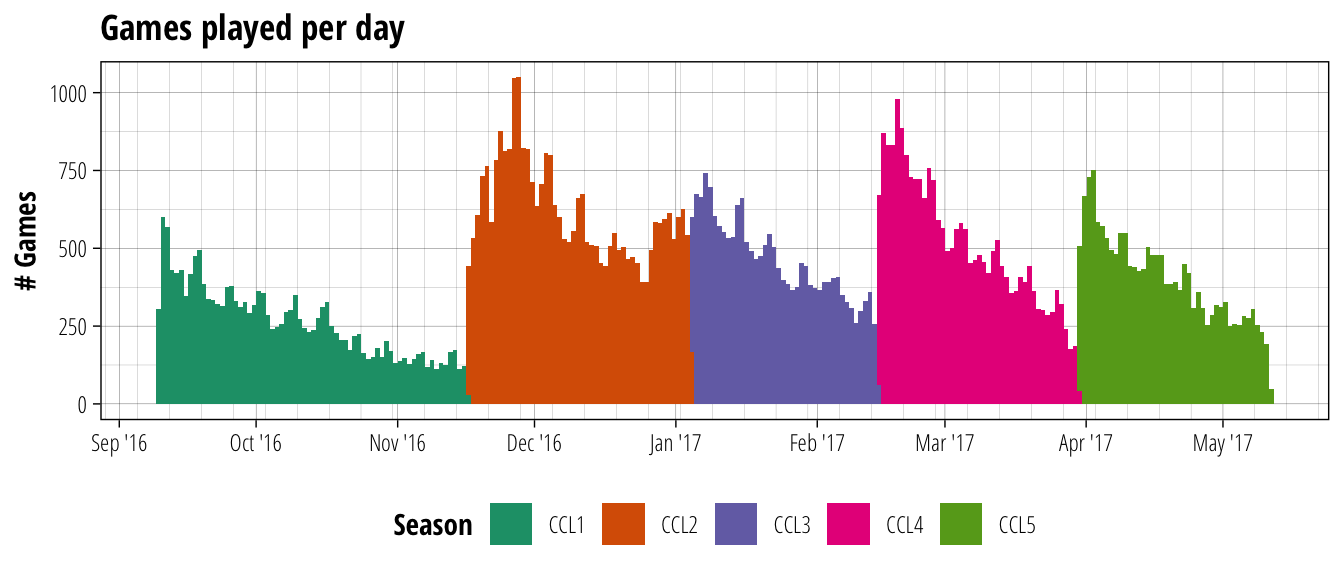
To keep things simple, our first exploration of the Champion Ladder data is going to mostly ignore game stats completely and just look at the timestamps for each game. Each game has a start and finish time recorded, and I’m going to make a guess that these are being recorded in Paris time given that is where Cyanide is based.
So how many Champion Ladder games get played in a day, and does it change over the course of a season?
The data We currently have available all Champion Ladder match data for seasons 1-51. This post will just be a quick rundown of what is in the dataset, so that I have a reference for when we start to do some real analysis.
The spreadsheets contain one line for each game, so the number of rows gives us the number of games and the number of columns are the number of parameters recorded for each match.


